Are you looking for a tool to track the performance of your website and search traffic? Google Analytics is the best available tool for you. Check this digital guide to Google Analytics for beginners to get a better understanding of Google Analytics.
It is very useful to track your website’s paid and organic searches with Google Analytics because it provides deep insights. Google Analytics conversion tracking is also useful to track and improve the conversion of your website.

You can get great insights and data about your website and audience with Google Analytics for free. It is very useful to track the performance of your website with multiple analytics reports that make your work more effective.
Get more details about Google Analytics metrics in the following part. It also includes the details about Google Analytics skills that you can learn with Google Analytics Academy for free.
Disclosure: If you make a purchase after clicking links in this article, I may make a referral income, at no cost to you.
Table of Contents
What is Google Analytics?
Google Analytics is a free web analytics tool developed by Google. It helps you to track the performance of your website traffic with insightful and detailed reports. It is one of the most popular web analytics tools that many professionals use.
You can check the different Google analytics metrics like Real-Time Data, Audience, Acquisition, Behavior, and Conversion. The data visualization and information on GA are very simple and easy to understand, making your work very easy with data.
Google Analytics is very useful for:
- Website Traffic & Performance Tracking
- Understanding your Website Visitors & Audience
- Improving your Digital Marketing Strategy
- Making SEO & Content Marketing more Effective
- Getting Better Insights of Paid Advertising
- Increasing your Website Conversion
- Developing Better Plans for Paid & Organic Growth
You can check the organic search for your website with GA. Because it is very simple to connect and integrate your Google Search Console with Google Analytics.
This integration can give you more detailed insights and data of organic search results for your website from Google Analytics.
Another key feature of Google Analytics is that you can integrate your Google Ads account with Google Analytics. It helps you check your Google Ads’ performance and the traffic you are getting from your paid ads.

Benefits of Google Analytics for your Online Business:
Check these benefits of Google Analytics for you as a Digital Marketing professional or your online business. It will help you to understand the use of Google Analytics better.
1. Complete Data Visualization
Google Analytics provides complete data visualization to the marketer that they can use to present the data in a better way. It also helps users to better understand the insights and details with the help of data visualization.
2. 360 Degree Reporting for your Website
You can check the 360-degree reporting of your website with Google Analytics. It helps you to develop a better understanding of your website data and to create a better representation of the website traffic data and insights.
3. 100% Free to Use
Google Analytics is a free web analytics tool that provides useful insights and data about your website for free. You can get detailed information about your website traffic, audience insights, and more with Google Analytics for free.
4. Detailed Information about your Audience
You can get the complete details and information about your audience. It will help you to develop a more effective business and marketing strategy. The information includes the details of the audience based on demographics, behavior, and location.
5. Understand & Develop your Sales Funnel
It is handy and beneficial for you to understand the traffic of website visitors on your website. Because you can make your marketing efforts more effective with it. You can design a Sales Funnel based on the interest and requirements of your audience. And, Google Analytics helps you in it.
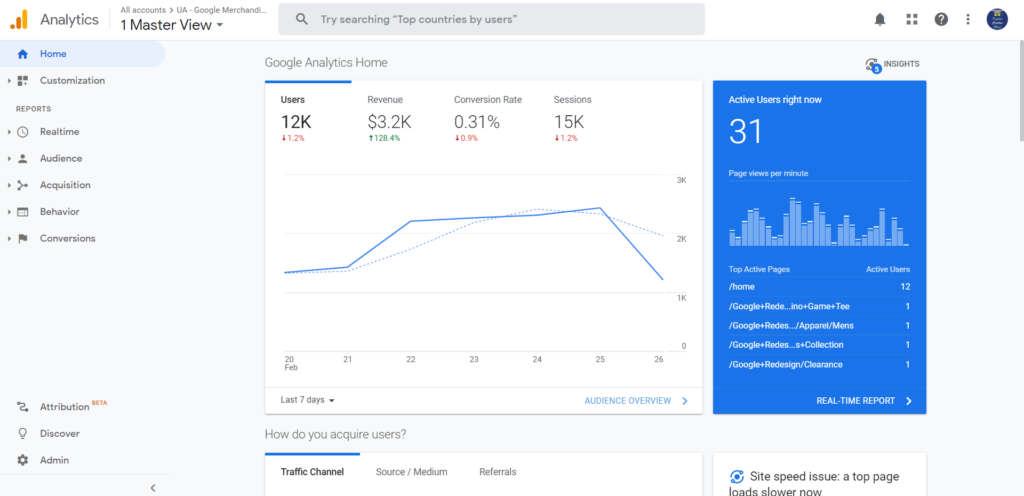
What you will get in “Google Analytics”:
Google Analytics provides you great insights into your website traffic and website visitors with well-visualized data and information. The data and information of Google Analytics include the following details:
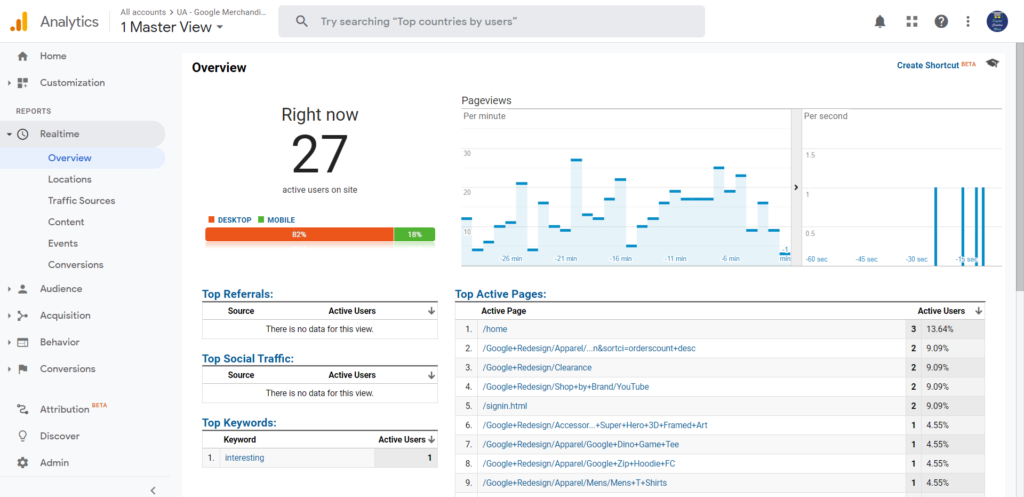
Number #1. Real-time Data
Real-time data shows the present time analytics and data of your website which includes real-time traffic and more details.
Overview: It shows the real-time active users on your website and gives you overall information about your website traffic. You can see the number of active users on your website and the time at which your audience is visiting your site.
Locations: It shows the real-time location of your website visitors from around the world. You can track the cities and the countries from where you are getting the traffic on a real-time basis.
Traffic Sources: It is the real-time source of your website from where you are getting the traffic on your website. It could be a search engine, social media, or direct to your website traffic.
Content: It includes your website pages on which you are getting real-time traffic. You can also check the most active pages of your website with the highest number of visitors in the content option.
Events: It shows the actions of your website visitors on the different pages of your website. You can know all about the actions of your website visitors and the number of visitors with a specific action on your website.
Conversions: It shows the number of website visitors taking action as per your desired goals. You can check your goals and the number of active users who are acting on your website with your desired goals.
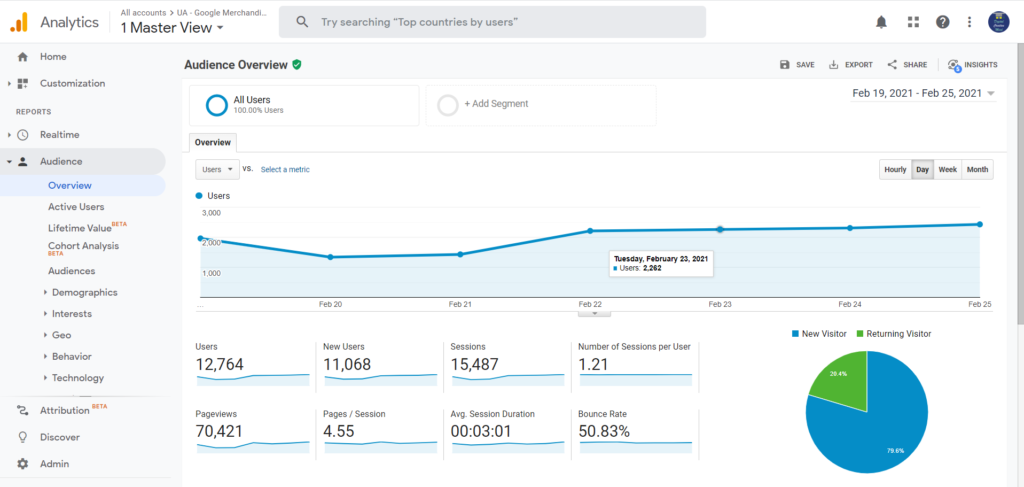
Number #2. Audience
The audience tab on GA shows you the details about your audience or visitors of your website in the different time periods.
Overview: You can check the details of the visitors of your website with Audience Overview. It provides you details about Users, New Users, Sessions, Number of Sessions per User, Pageviews, Pages/Sessions, Average Session Duration, and Bounce Rate.
Active Users: It shows the information and details of the website visitors on different dates and times. You can check the number of active users on different dates and in different weeks & months.
Audiences: It gives you more detailed insights about your website visitors with in-depth information and data.
- Demographics: It helps you to understand the age and gender of your audience and website visitors who are visiting your website.
- Interests: It shows the number of website visitors of different categories – Affinity Category, In-Market Category, and Other Category.
- Geo: It provides the details related to the language and location of your website visitors. You can easily check from which region you are getting more traffic.
- Behavior: It shows the different factors that help you to understand the behavior of your audience. It includes new vs. returning traffic, engagement, session quality, and conversion probability.
- Technology: It shows the details of the device your audience is using like the browser and operating system of the device. You can also check the network of your audience.
- Mobile: Here you get the details of the devices used by your website visitors. It could be mobiles, desktops, or tablets, these are the most common categories of devices that your audience use.
- Benchmarking: It helps you to better understand your website traffic by benchmarking the details in terms of traffic channels, locations, and devices.
User Flow: User flow shows the flow of traffic on your website with different factors like country, acquisition, social, and advertising. It also shows the flow of traffic from one page to another, where your website visitors visit your website.
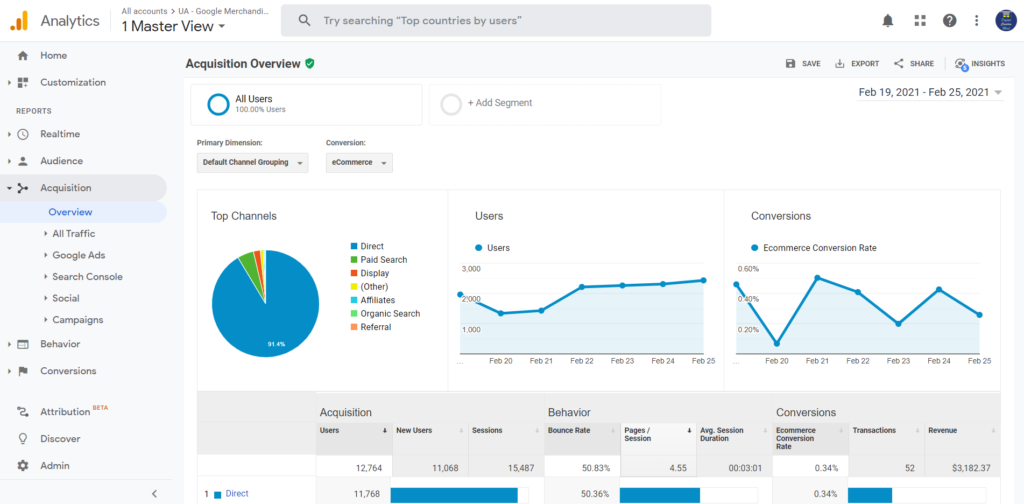
Number #3. Acquisition
The Acquisition gives you complete information about channels and sources of traffic on your website with detailed data.
Overview: It shows the different sources of traffic on your website which include Direct, Paid Search, Affiliates, Display, Organic Search, and Others. It allows you to check the major sources of traffic on your website that you can use to improve the conversion of your website.
All Traffic: It helps you to check the details of the traffic on your website. It includes the following:
- Channels: You can check here – the traffic source on your website with the details like acquisition, behavior, and conversion.
- Treemaps: It is the visual representation of the different sources of traffic on your website like Direct, Paid Search, Display, Affiliate, or Referral.
- Source/Medium: It shows the highest to lowest traffic generating source to your website.
- Referrals: It gives information about the sources which are referring traffic to your website.
Google Ads: You can integrate and check the performance of your Google Ads with Google Analytics here. It includes the details like bid adjustments, keywords, search queries, display targeting, video campaigns, and shopping campaigns.
Search Console: You can connect your Google Search Console with GA to get better insights about your website traffic.
- Landing Pages: It helps you to discover the pages on your website which are attracting a good amount of organic or paid traffic.
- Countries: You can use this option to find the geographical location of your website visitors on a daily, weekly, or monthly basis.
- Devices: This option helps you to check the devices used by your visitors to visit your website. It could be mobile, desktop, or tablet.
- Queries: It includes the search queries which helped you to get the impression and click from the search engine.
Social: You can get the details of the social analytics here, like the amount of traffic from different social media channels. It helps you to find the channels, where you are getting more content engagement and impressions. You can also compare all sessions with the sessions via social referral.
Campaign: If you are looking for detailed information about your Paid Campaigns, it is the right place to check. You can get information about the factors like Paid Keywords, Organic Keywords, and Cost Analysis. It gives an overview of the traffic and impression you are getting as per the cost paid by you.
Number #4. Behavior
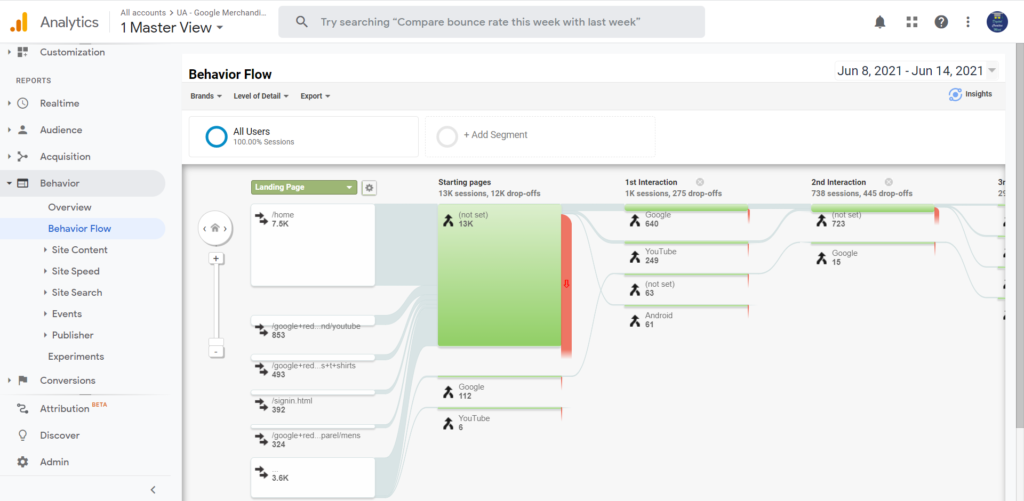
Behavior shows the actions of the website visitors on your website and the behavioral paths of your audience through different pages of your website.
Overview: It includes Pageviews, Unique Pageviews, Average Time on Page, Bounce Rate, and Exit Rate on your website. You can check the pages with the most traffic to find the best-performing content on your website. It is also useful to track the performance of different pages here.
Behavior Flow: It defines the behavioral path followed by your website visitors on your website through different pages. The other factors of Behavioural Flow include:
- Site Content: You can see the content performance of different pages on your website here with Content Drilldown, Landing Pages, and Exit Pages.
- Site Speed: It helps you to know the average speed of the pages of your website with Page Timing, Speed Suggestion, and User Timing.
- Site Search: Here you can check the unique searches for your website with Search Terms and Search Pages.
- Events: These are the action taken by the visitors to your website. It includes Top Events, Pages, and Events Flow.
- Publisher: It helps you to track the performance of your content with Google AdSense. You have to link your AdSense Account with GA to check the performance.
Experiments: Content Experiments are the experiments that you can create to run A/B testing for your marketing campaigns. It is no longer available on Google Analytics, now you can use Google Optimize to create new experiments.
Number #5. Conversions
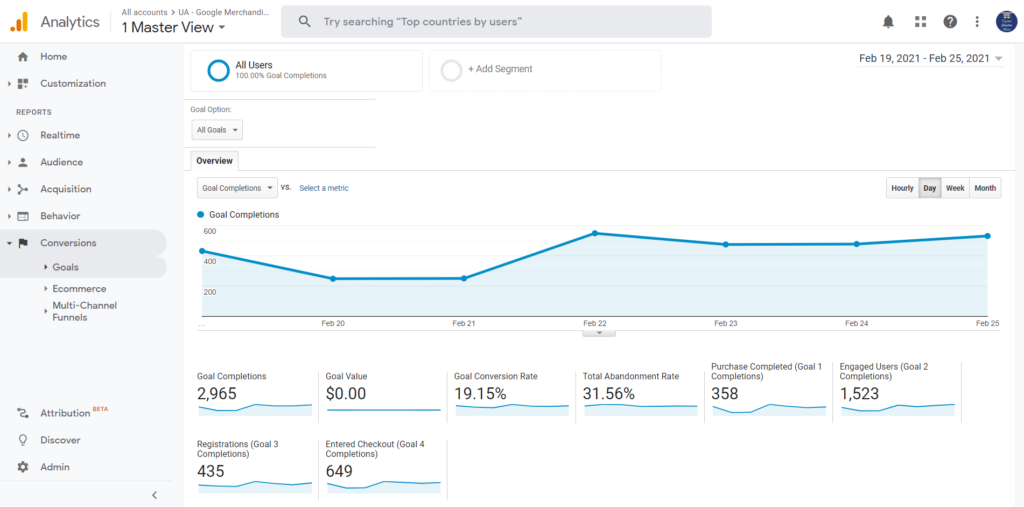
Conversions help you to track the performance of your website (conversion) with the goals set up by you. It helps you to improve your sales with better conversion.
Goals: You can track your marketing efforts’ performance by tracking your goals. It helps you to improve your conversion by covering the following factors:
- Goal Completion
- Goal Value
- Goal Conversion Rate
- Total Abandonment Rate
- Other Goals set by you
E-Commerce: You can track the performance of your eCommerce business here, with details like Revenue and eCommerce Conversion Rate. It includes the following details:
- Shopping Behaviour
- Checkout Behaviour
- Product Performance
- Sales Performance
- Product List Performance
- Marketing
Multi-Channel Funnels: It shows the conversions on your website from different channels which are called Multi-Channel Conversion Visualizer. It includes the following:
- Assisted Conversions
- Top Conversion Paths
- Time Lag
- Path Length
- Comparison Tool
Develop your Analytics Skills with Google Analytics Academy
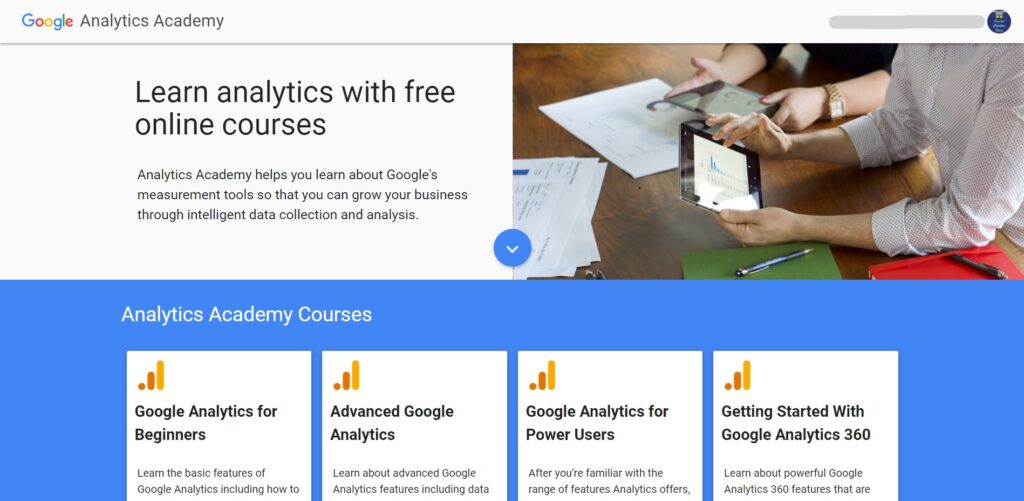
Are you looking to learn more about GA and grow your analytics skills? You can check the free training and certifications provided by Google Analytics Academy. It offers the following certifications which are free of cost:
- Google Analytics for Beginners
- Advanced Google Analytics
- Google Analytics for Power Users
- Getting Started with Google Analytics 360
It is very useful to learn data analytics because it helps you to make more sound and effective decisions with the information. Google Analytics Academy can help you to develop this skill with detailed information and without any cost.
Final Words:
This was the guide to Google Analytics which took you into the details that you might need before using it. You can get the different reports that GA provides with meaningful insights and data about your website.
Try “MonsterInsights” the best WordPress Website Analytics Plugin for Beginners to get complete data and insights into their website:

Google Analytics is one of the most important Google Tools for Digital Marketing Professionals and Bloggers. It is a very useful web analytics tool that provides many useful insights about your website and visitors.
It makes your business and marketing strategy more effective with more sound decisions based on accurate information and data. You can run experiments and track the performance with help of Google Analytics to make better decisions.




![13 Best Digital Marketing Side Hustle Ideas [For Beginners] 13 Digital Marketing Side Hustle Ideas](https://digitalcreativemind.com/wp-content/uploads/2024/06/13-Digital-Marketing-Side-Hustle-Ideas-1024x576.png)
